As a blogger, we always try to find ways to present data to our dear readers in a manner which is very pleasing to the eyes. This could include but not limited to lists, graphic presentation or charts.
As we try to give you readers a detailed information for our upcoming reviews, we've successfully found a way to properly present information in a tabular manner. This table is first seen in our previous post which is the promo offered by Cherry Mobile in Partnership with Globe Telecom.
To further narrate the ways to create tabular content in a blog post, please see the steps below:
- Create the content you want in Excel, Word, Spreadsheets ( or any application that could grant you a spreadsheet kind of data )
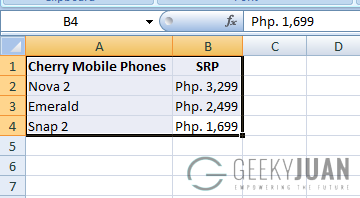
- Copy the content by highlighting all the details you've placed. (See image given below)
- Go to http://tableizer.journalistopia.com/
- Place the copied content in the text field and edit other options as desired
- Click on "Tableize It!" button
- Copy the HTML code given and paste it in the HTML view of your blog post
The image shown above is the excel file we made for creating a tabular data for the list. As you could see in their site, there is also a feature where you could edit a header color so you could properly label each column of your post as you desired.
Should you have any concerns or something that needs clarification about this tutorial, please use the comment section below.
'Til our next post!


Post a Comment